The Agile world is rife with misconceptions about SAFe®, particularly around estimating with Story Points. That leads to bad practices standing uncorrected and being repeated over and over again. Dive into an exploration that challenges popular beliefs about estimating in SAFe and uncovers the true essence of Story Points. Whether you’re new to SAFe or think you’ve heard it all, this article promises fresh insights, debunking myths and guiding you through the agile maze with clarity and precision. Read this article if you want to know how proper agile estimation works, since years, and still with SAFe.
TLDR: When using SAFe®, we keep proven agile estimation practices. We do add another level of flow. However, this follows the same principles.
- Good SAFe implementations, namely estimation, utilize the existing history of agile knowledge.
- SAFe has Product Backlog items at several levels of flow. This article looks at the Team Backlogs first, and then at the Team-of-Teams (ART) Backlog.
- No, in SAFe we do not measure normalized Story Points based on ideal developer days. That is wrong, and if done that is a problem.
- We estimate the size of Product Backlog items relative to other estimated items.
- Before we start estimating with Story Points, we must define what “1” means.
- It helps when teams that work together have an aligned understanding of size, but it is not necessary.
- Once you have started estimating with your definition of “1”, all estimated Product Backlog items become reference points for further relative size estimations.
- We measure Velocity and forecast Capacity.
- Only for a new team we calculate – guess – initial Capacity.
- With Story Points and Velocity, we can forecast delivery dates.
- Story Points are not for comparisons or compensation.
- A team can’t stop relating Story Points to fixed effort? Use T-shirt sizes.
- Features can have their own relative size.
Good SAFe® implementations, namely estimation, utilize the existing history of agile knowledge.
What I like about SAFe is that it brings together existing agile frameworks and methods. This allows us to build on the long history of agile experience when implementing SAFe. This is especially true for estimation in SAFe.
So, in this blog article, I deliberately build bridges between SAFe, Scrum and Kanban, in terms of knowledge and terminology. I do this for three reasons.
- A good SAFe implementation is true to the embedded frameworks.
- There is a wealth of knowledge around the embedded frameworks that helps us build good SAFe implementations, in this case good estimations.
- We need to build bridges between people with different backgrounds in using frameworks. With a nod to the agile manifesto, bringing people and their interactions together requires even more attention than bringing the frameworks together.
In this article, I hope to show how this mindset helps to achieve good estimation practices in a multi-team environment using SAFe.
SAFe® has Product Backlog items at several levels of flow. This article looks at the Team Backlogs first, and then at the Team-of-Teams (ART) Backlog.
In multi team settings we typically have Product Backlog items on different levels of flow.
SAFe uses Stories (which fit into a Sprint/Iteration) and Features (which fit into a larger cadence of multiples of Sprints/Iterations, the Planning Interval or PI). In this article, we will look at two essential levels: The Team Backlogs contain Stories, and the higher-level ART Backlog contains Features. (ART is an acronym for Agile Release Train, which is a team of teams.)
The ART Product Backlog (Features) and the Team Product Backlogs (Stories) are what Scrum calls the Product Backlog. Understanding this helps to apply existing estimation knowledge to both levels. If we understand estimating Stories, we understand estimating Features. It should not be much different, since both are Product Backlog items.
So, let us first look at the Story level of Team Backlogs. I will then transfer the things said to the Feature level of the ART Backlog. If something applies to the ART Backlog as well as to the Team Backlogs, I will call it a Product Backlog without reference to ART or team.
No, in SAFe® we do not measure normalized Story Points based on ideal developer days.
Many articles wrongly claim that SAFe suggests that this is how things should be done (e.g. Kevin Bendeler). Yes, this is what many people do. But no, this is not how SAFe suggests this is done (see Iteration Planning and WSJF). SAFe is not the problem. So, let’s see how proper estimation works in a multi team setting.
We estimate the size of Product Backlog items relative to other estimated items.
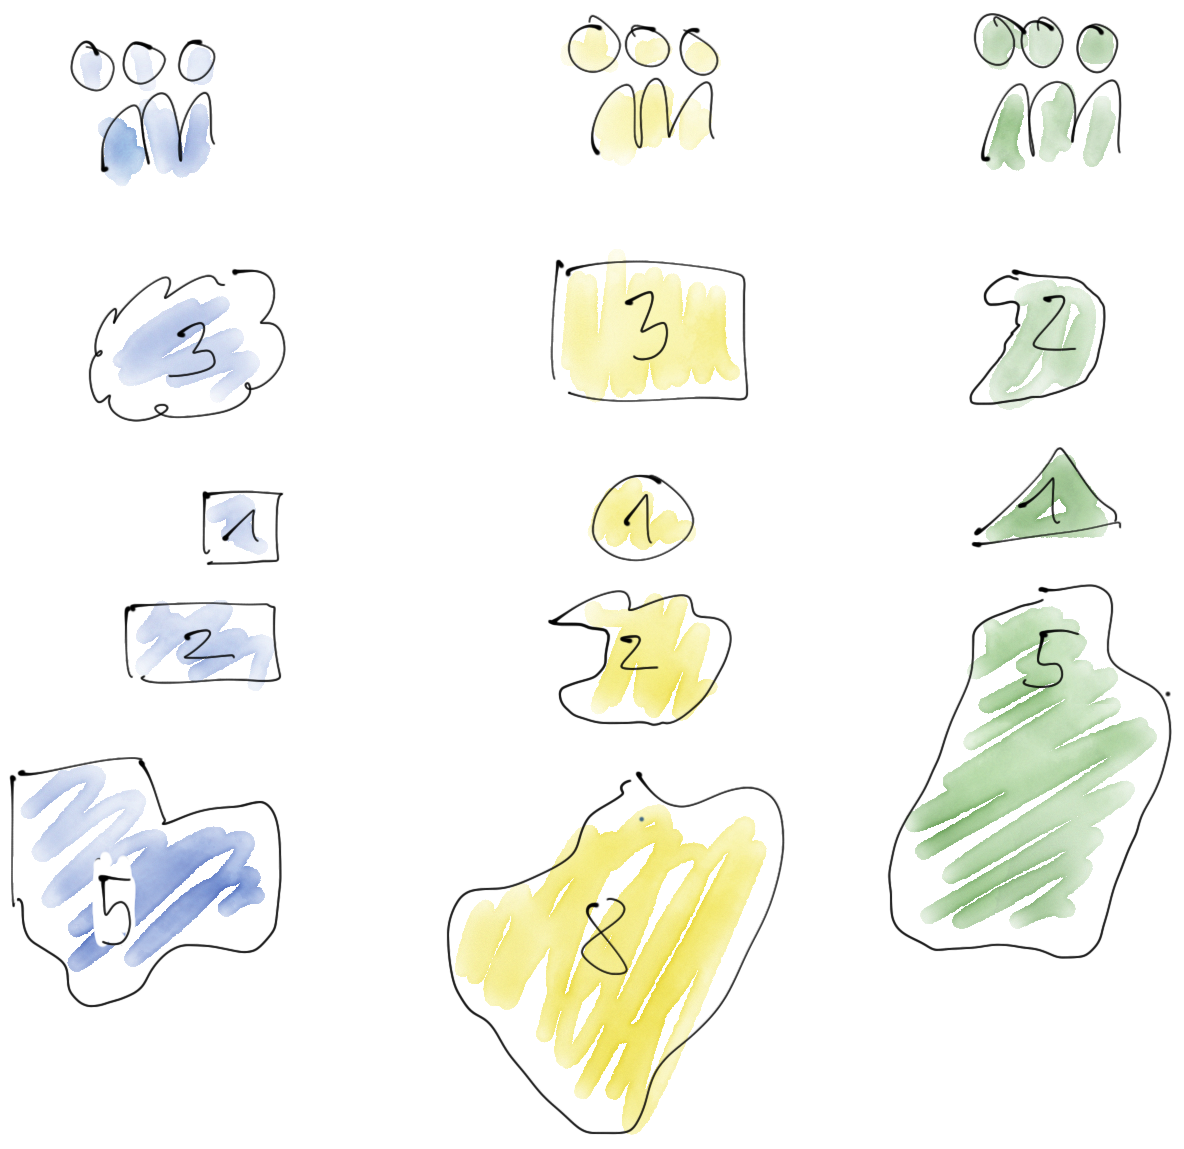
The number you give to the size of a Team Product Backlog item (“Story”) is called Story Points. Story Points are a relative estimate. This means that an item with 2 Story Points is twice the size of an item with 1 Story Point, and an item of 8 Story Points is 8 times the size as an item with size 1 or four times as much as an item with size 2. In comparison to a 1 SP Story, a 2 SP Story should cost approximately 2x as much effort to implement.

Story Points are related to each other, but Story Points have no fixed relation to effort (and that includes things like ideal developer days). The reason for relative estimates is that they save us the time to re-estimate when a team becomes faster. It also allows us to understand throughput and to make forecasts – things we like with an empirical mindset. The size of Product Backlog items is estimated by developers.
An important thing to understand about an estimate is that it is not a number, but a probability distribution around the estimate. If we estimate that an item has a size of 2, the actual value (once we implement it and know the actual size) could be anything, but a 2 is more likely than a 13. The uncertainty and spread of the distribution increases with larger estimates. This is why the range of Story Points spreads out as it gets larger (3, 5, 8, 13 …).
Before we start estimating with Story Points, we must define what “1” means.
As an independent unit of size, Story Points need a definition of what “1” means. Typically, we find a Story that we can use as a reference for the size “1”.
SAFe suggests choosing a Team Product Backlog item that takes “half a day to develop plus half a day to test and validate”. It cannot be emphasized enough that this is only a guide to find the size “1” Story. The reference is the Story found, not the person-day, and certainly not an “ideal” person-day (there is no such thing in SAFe).
If you prefer a different heuristic for finding the size 1 Story, feel free to use it. Teams can agree on any way to find that “1” as long as it produces a reference Story.
It helps when teams that work together have an aligned understanding of size, but this is not necessary.
If you have multiple teams who work together on the same Product Backlog, it helps if they have a similar definition of “1”. This enables teams to discuss size across teams. E.g., when they work together on a shared Feature, or if they pass a Story from one team to another.
If each team picks an initial Story that will take ‘half a day to develop plus half a day to test and validate’, we achieve this. I often ask teams to make sure that when they compare their size “1” Stories, they are all indeed the same size.
When the relation of Story Points is not only agreed in one team, but across teams, this is called “aligned” or “approximately normalized” in SAFe. However, aligning Story Points across teams is not necessary. It is an option, and often Story Points align anyway due to cooperation between teams.
Once you have started estimating with your definition of “1”, all estimated Product Backlog items become reference points for further relative size estimations.
We only need to find the “1” once in the life of a Product Backlog. Later, as we estimate more Product Backlog Items, there is a wealth of Product Backlog entries with size estimates. All of them can be used as a reference. Never again will we think about how we came to choose the size “1” reference Story.
We measure Velocity and forecast Capacity.
At the end of every timebox/cadence (e.g. Sprint/Iteration or Planning Interval/PI), we can count the number of Story Points of all the Stories done in the timebox. We can correlate this to the effort spent. This number is called Velocity.
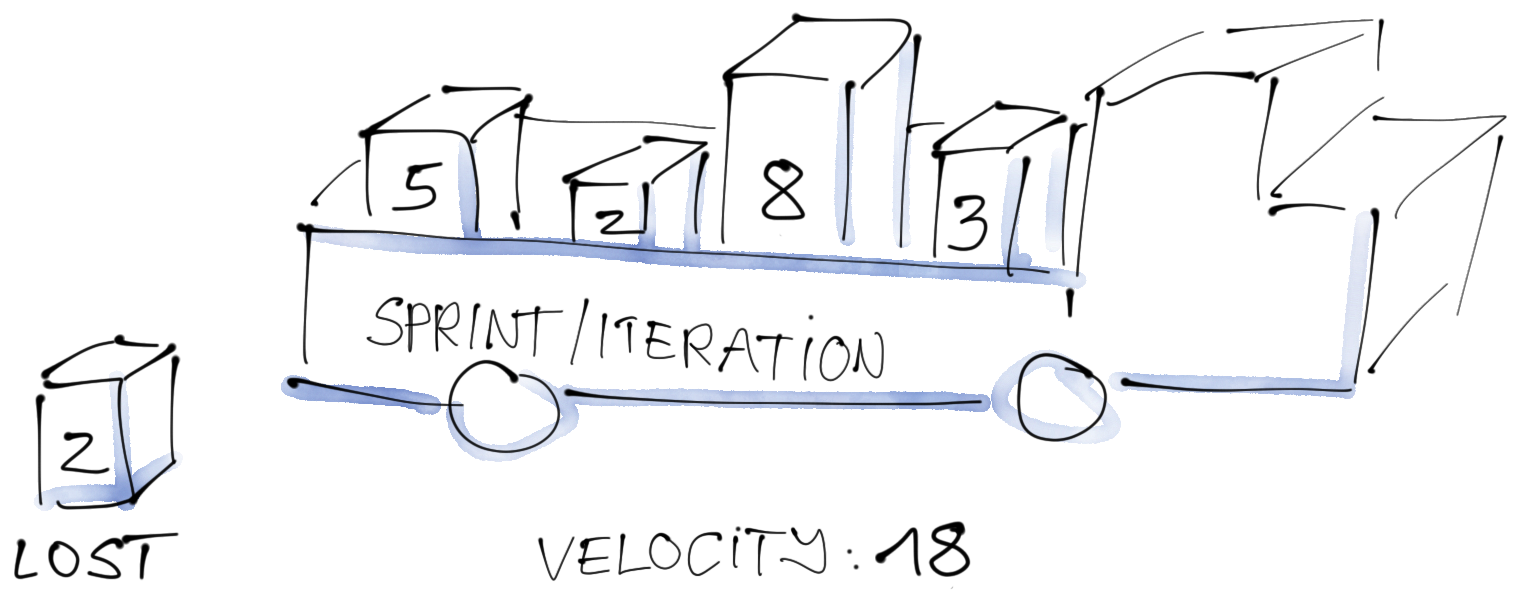
Velocity is similar to Throughput, which is often used in Kanban systems to measure work items delivered per time period (see Kanban Glossary or SAFe Measure and Grow Article). In contrast to Throughput, Velocity takes into account the different sizes of items.
Velocity (or Throughput) will gradually change over time, especially as a team improves.
Velocity is useful to make a forecast of what the Velocity of upcoming Sprints/Iterations could be. This forecast is called Capacity. It helps to shape a Sprint/Iteration Goal and select the Stories that the team forecasts to deliver in the next Sprint/Iteration. Of course, future Velocity is statistics: The forecast is an estimator with variance. Tina may become ill, the actual size of the Story may vary from the estimated size, and other things may happen.
Only for a new team we calculate – guess – initial capacity.
When a team is new, we do not have any data. Therefore, we cannot forecast capacity. There are several ways to get around this.
SAFe suggests calculating the Capacity for the first Sprint/Iteration. SAFe uses 8 Story Points per developer for a 2 week Sprint, or more generally 0.8 Story Points per workday. 0.8 Story Points per workday take into account the time spent for the Sprint events and Refinement.
Another option to determine the Capacity for the first Sprint/Iteration would be to select Stories for the Sprint and then to count the number of Story Points.
You can choose either way. It does not really matter, because we only do this once in the life of a team. After that initial Sprint/Iteration, we measure Velocity and forecast Capacity (see above). We rarely calculate Capacity again.
With Story Points and Velocity, we can forecast delivery dates.
Stakeholders often want to know when items will be completed. With Story Points and Velocity, we can provide estimates for the “when will it be completed” question. By multiplying the Story Points by the measured Velocity, we have an estimate of the time it will take to complete those Story Points.
For example, if there are Product Backlog items with 100 SP, and we have a current Velocity of 10 SP/Sprint, those items will take 10 Sprints. Not exactly, of course, because the time is an estimate with variance and a confidence interval. This technique can be found in many amusement parks, where at certain lengths of the queue, signs indicate the amount of time to wait from that point.
There are two advantages to forecasting delivery dates using Story Points and Velocity. First, the delivery date is based on measurements, not wishes. Second, as the Velocity changes, the forecasts of the delivery dates follow that change.
One thing to communicate about these forecasts is that the items and their order are changing: Product Backlogs are emergent. All forecasts are based on the current state of uncertainty. If we need to, we can measure this change and incorporate it into our forecasts. However, a forecast based “only” on Velocity and Story Points is a valuable first step and good enough for many organizations.

Story Points are not for Comparisons or Compensation.
Story Points help teams to discuss stories, do empiricism, and make forecasts. There is often a strong desire to measure and compare the delivery of teams and people. This is not what Story Points are for.
Some people use Story Points to pay teams. This is also not what Story Points are for. Paying by Story Points is just like paying bonuses, defocusing teams from their goals. (See “Large Stakes and Big Mistakes” from the Federal Reserve Bank of Boston). Of course, we all know this from Scrum, so we won’t change it when Scaling.
A team can’t stop relating Story Points to fixed effort? Use T-shirt sizes.
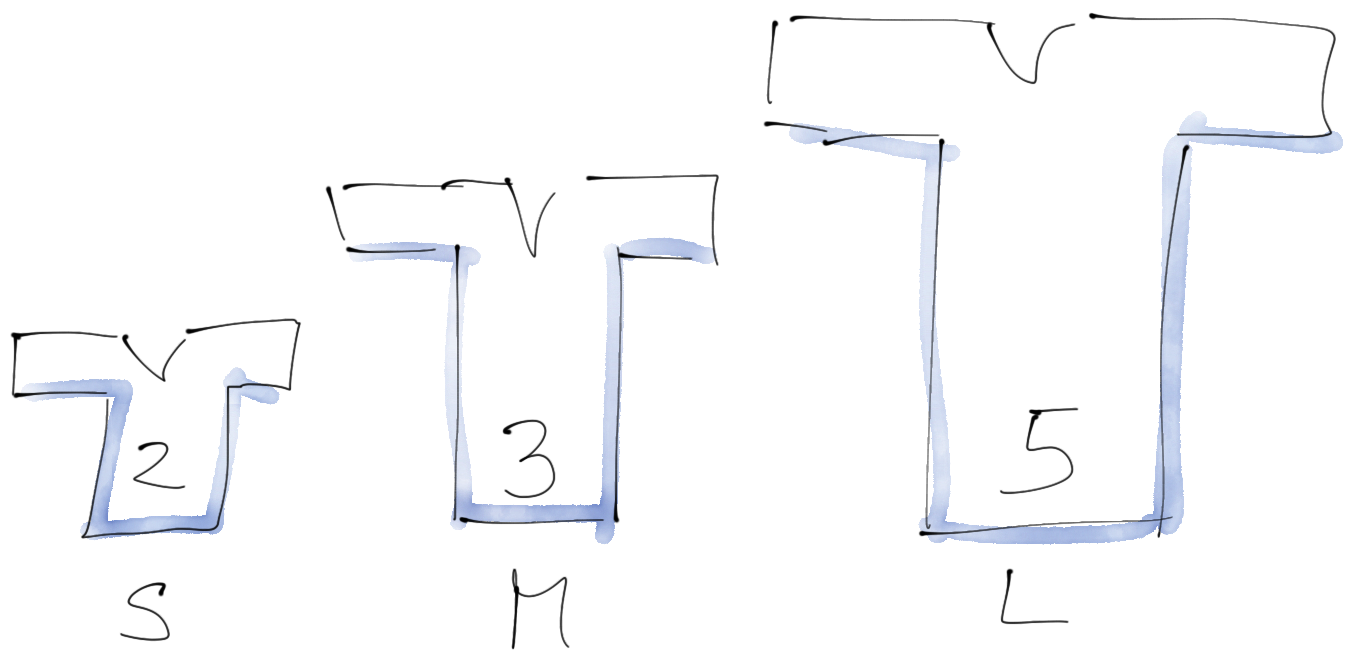
Often teams get caught up in estimating Story Points: They continue to relate them to fixed effort; They have a hard time wrapping their heads around the fact that each estimate represents a distribution (“something around 13”) rather than a number.
When this happens, I use T-shirt sizes (XXS to XXL). Often you still want to do math with the size estimates, such as velocity measurements, delivery date forecasts, or capacity forecasts. You can do this with establishing a relation between the T-shirt sizes and mapping each T-shirt-size to a Story Point number.
If a team is not comfortable with estimates („no estimating“), similar sized Stories and the use of Throughput also work. This allows forecasts to be made just as well as with Velocity and Story Points.
Features can have their own relative size.
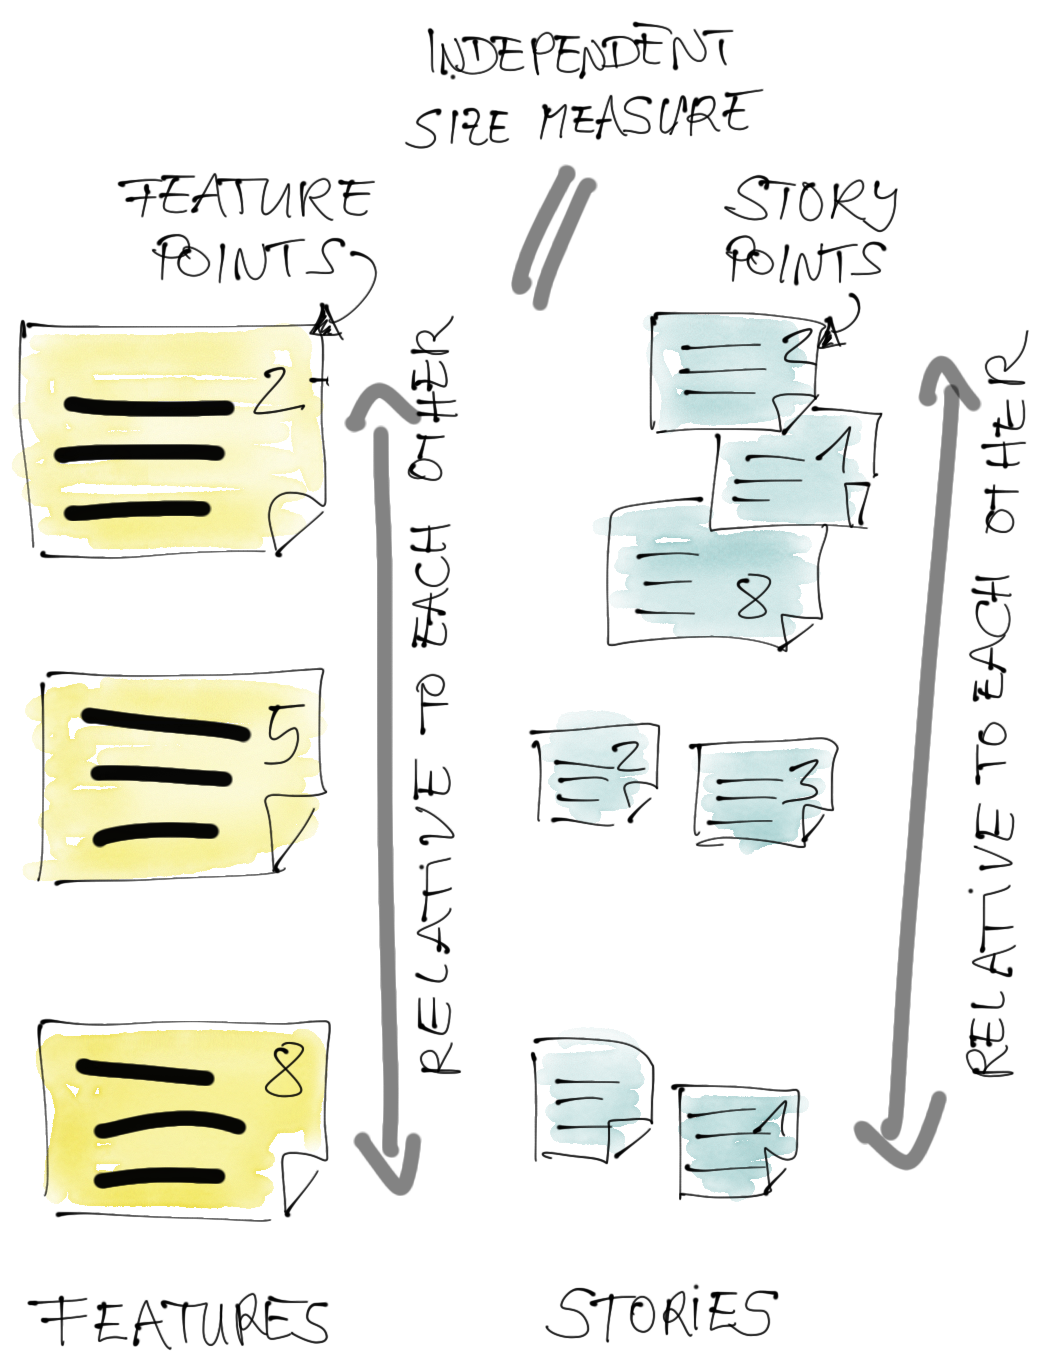
For Features in the ART Product Backlog, all the things we have said before apply in the same way. We estimate the size relatively. We measure Velocity and we forecast Capacity for a Planning Interval (PI).
One option is to use Feature Points as an independent unit of size for ART Backlog items. Feature Points work the same way as Story Points, just on the higher level of the ART Backlog. Feature Points have no direct relation to Story Points, just as Story Points have no direct relation to time.
Another option is to estimate the size of Features in Story Points, too. In this case there is not only a relationship between Stories, but also between Features and Stories. If you want to use Story Points for Features, the Story Points must be aligned between teams. You will also be using “big” Story Points, such as 100, 200, etc. SAFe talks about both options. After all, it is your choice. I am a fan of Feature Points to keep things loosely coupled.
Size estimates for Features should be done by team representatives. SAFe indeed suggests this. While Product Owners are team representatives from a scaling point of view (they are a member of the Scrum Team), I personally like to have developers in the room, too, when estimating the size of Features.
Do not change anything in the concept of Story Points when Scaling.
Long story short: The concept of Story points is old, and with SAFe we do not change it. If the concept appears to be different, something is probably wrong.
Thank you, reviewers.
Estimating is a tough topic. I thank my many reviewers who vastly improved this blog article: David Croome, Tina Behers, Alexander Post, Simon Porro and Michele Lanzinger.
Do you want to know more? Come to one of our trainings.
We discuss these topics in our Leading SAFe training or in our Implementing SAFe training. Experience a training with a lot of hands-on activities, good discussions and experienced experts. Meet the people with the most practical experience in scaling agile and establishing business agility.
Read my other article about SAFe estimation:
SAFe and Scaled Agile Framework are registered trademarks of Scaled Agile, Inc.
That’s what our readers think
Thanks great input, relevant to still have focus on this when you are talking about SAFe
Dear Tim, thank you for the feedback. Yes, all what we have learned about agile is still relevant with SAFe. I think this is the key guardrail to implementing SAFe: keep what we have learned.
Thanks! Great article.
Learned about it via the SPC-Community.
Glad that I took the effort to come over here and read it.
Certainly going to share it around to get (yet another 😉 ) discussion on the value of Feature-/Story-points and the way to handle them.
Hello Bart, thank you for the encouraging feedback.