In the SAFe® training courses, there is a slide on Story Points and Capacity that is quite tricky. This slide is often misinterpreted. This leads to two big mistakes. (1) The Capacity calculation formula “8 points for every full-time developer” is used every Iteration/Sprint. (2) The relationship “assign one point to a Story that would take about a half day to develop and a half day to test and validate” is used repeatedly and not to find the reference Story for size “1”. Even worse, many people believe that this is what SAFe proposes. Read this article to see what that slide is, how it is misunderstood, and how to get it right.
TLDR: A key slide in SAFe® training courses leads to misunderstandings about estimating and bad practices. This does not have to be the case.
- Take the “Calculate your capacity” slide in the PI Planning simulation with a grain of salt.
- The slide talks about Story Points and Capacity, which are different things.
- The slide says, “Calculate your capacity.” But it is only about calculating initial Capacity.
- After the initial Iteration/Sprint, forecast Capacity based on measured Velocity.
- Understand the assumptions behind the “8 points for every full-time developer”. Make adjustments if necessary.
- The slide is about finding a reference Story that represents “1” Story Point.
- Story Points have a relationship to effort that changes over time.
- All techniques on the slide are optional.
- To get it right, refer to the Iteration Planning article on the SAFe website.
- Here is a general piece of advice for implementing SAFe®. Stay true to the embedded frameworks and use the wealth of agile knowledge as guardrails.
Take the “Calculate your capacity” slide in the PI Planning simulation with a grain of salt.
A key element of SAFe training courses is the PI Planning simulation. It is part of the Leading SAFe, Implementing SAFe, and SAFe for Teams training courses, among others. In the PI Planning simulation there is one slide that explains how to “Calculate your capacity”. This is an important but also tricky slide that leads many people to misunderstand estimation in SAFe. This slide should be taken with a grain of salt.
In this article, I will explain the pitfalls of the slide, common misunderstandings, and how to avoid them.
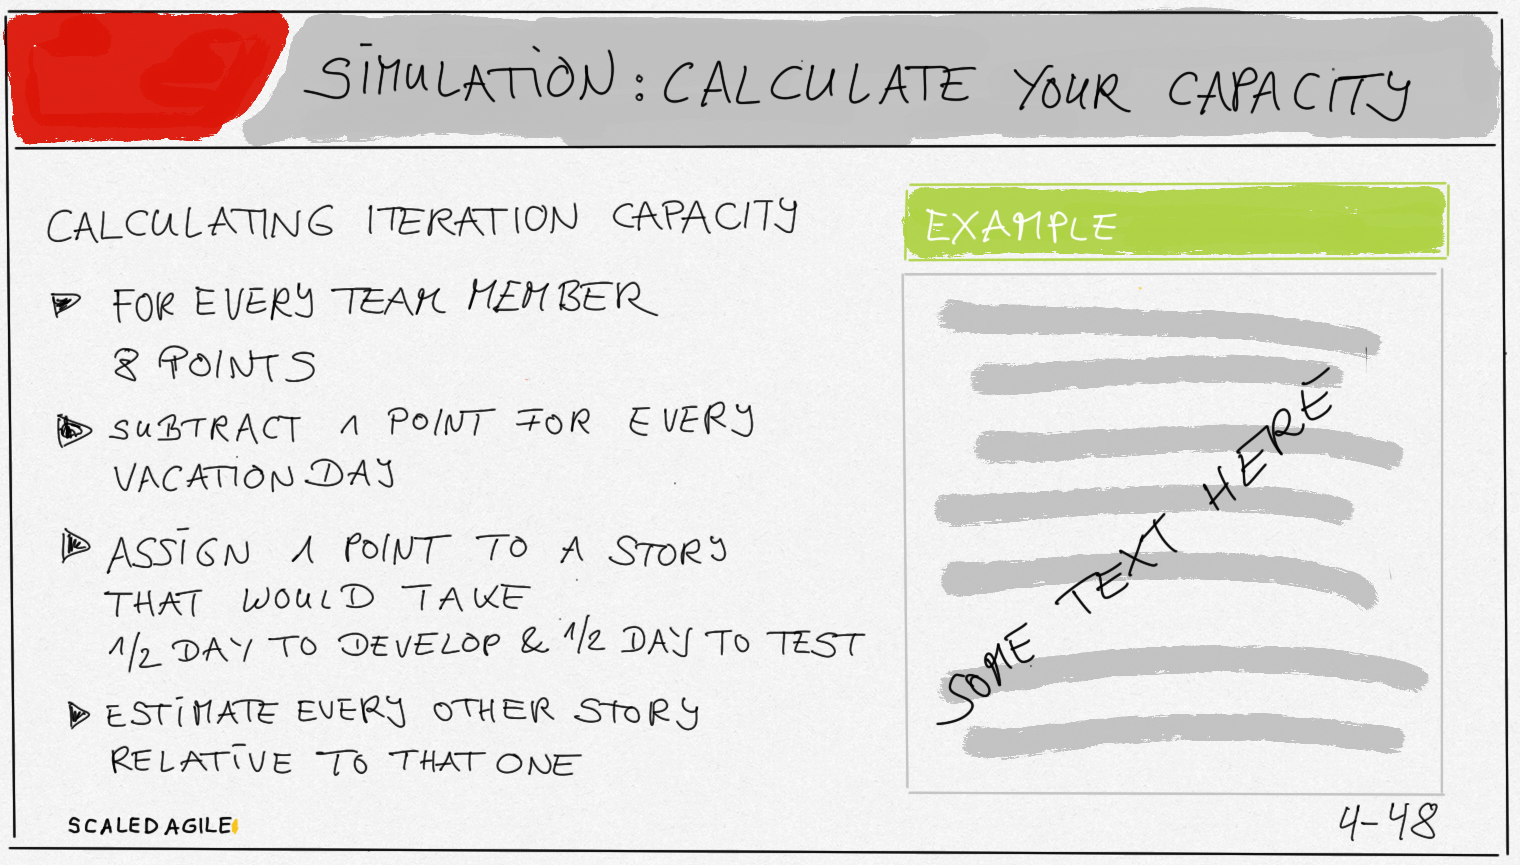
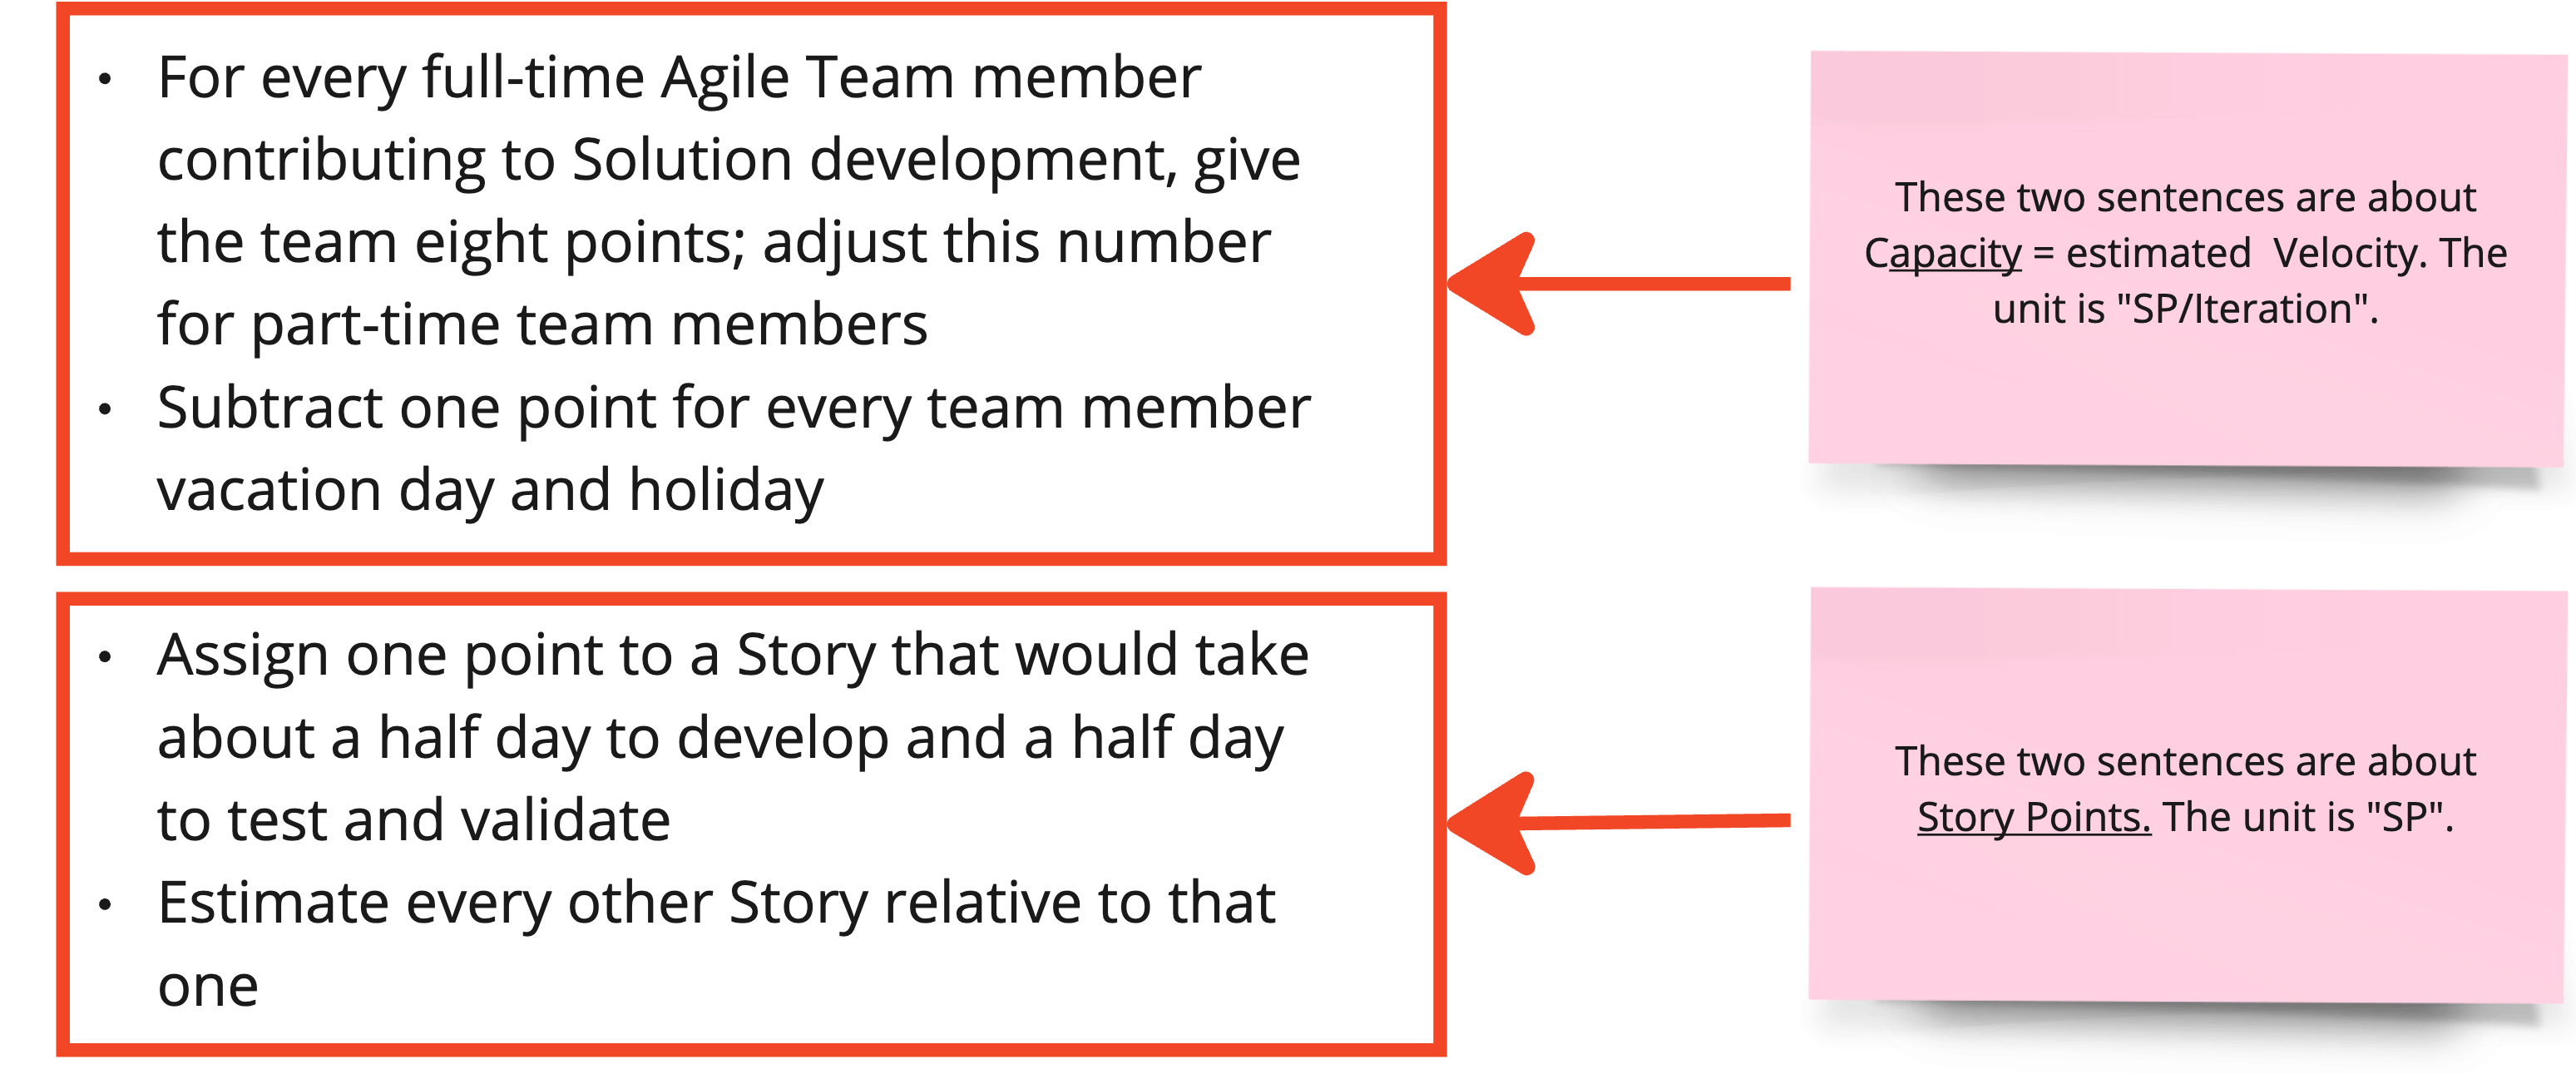
The four bullets on the slide under the Headline “Calculating Iteration Capacity” are as follows (text © Scaled Agile, Inc.):
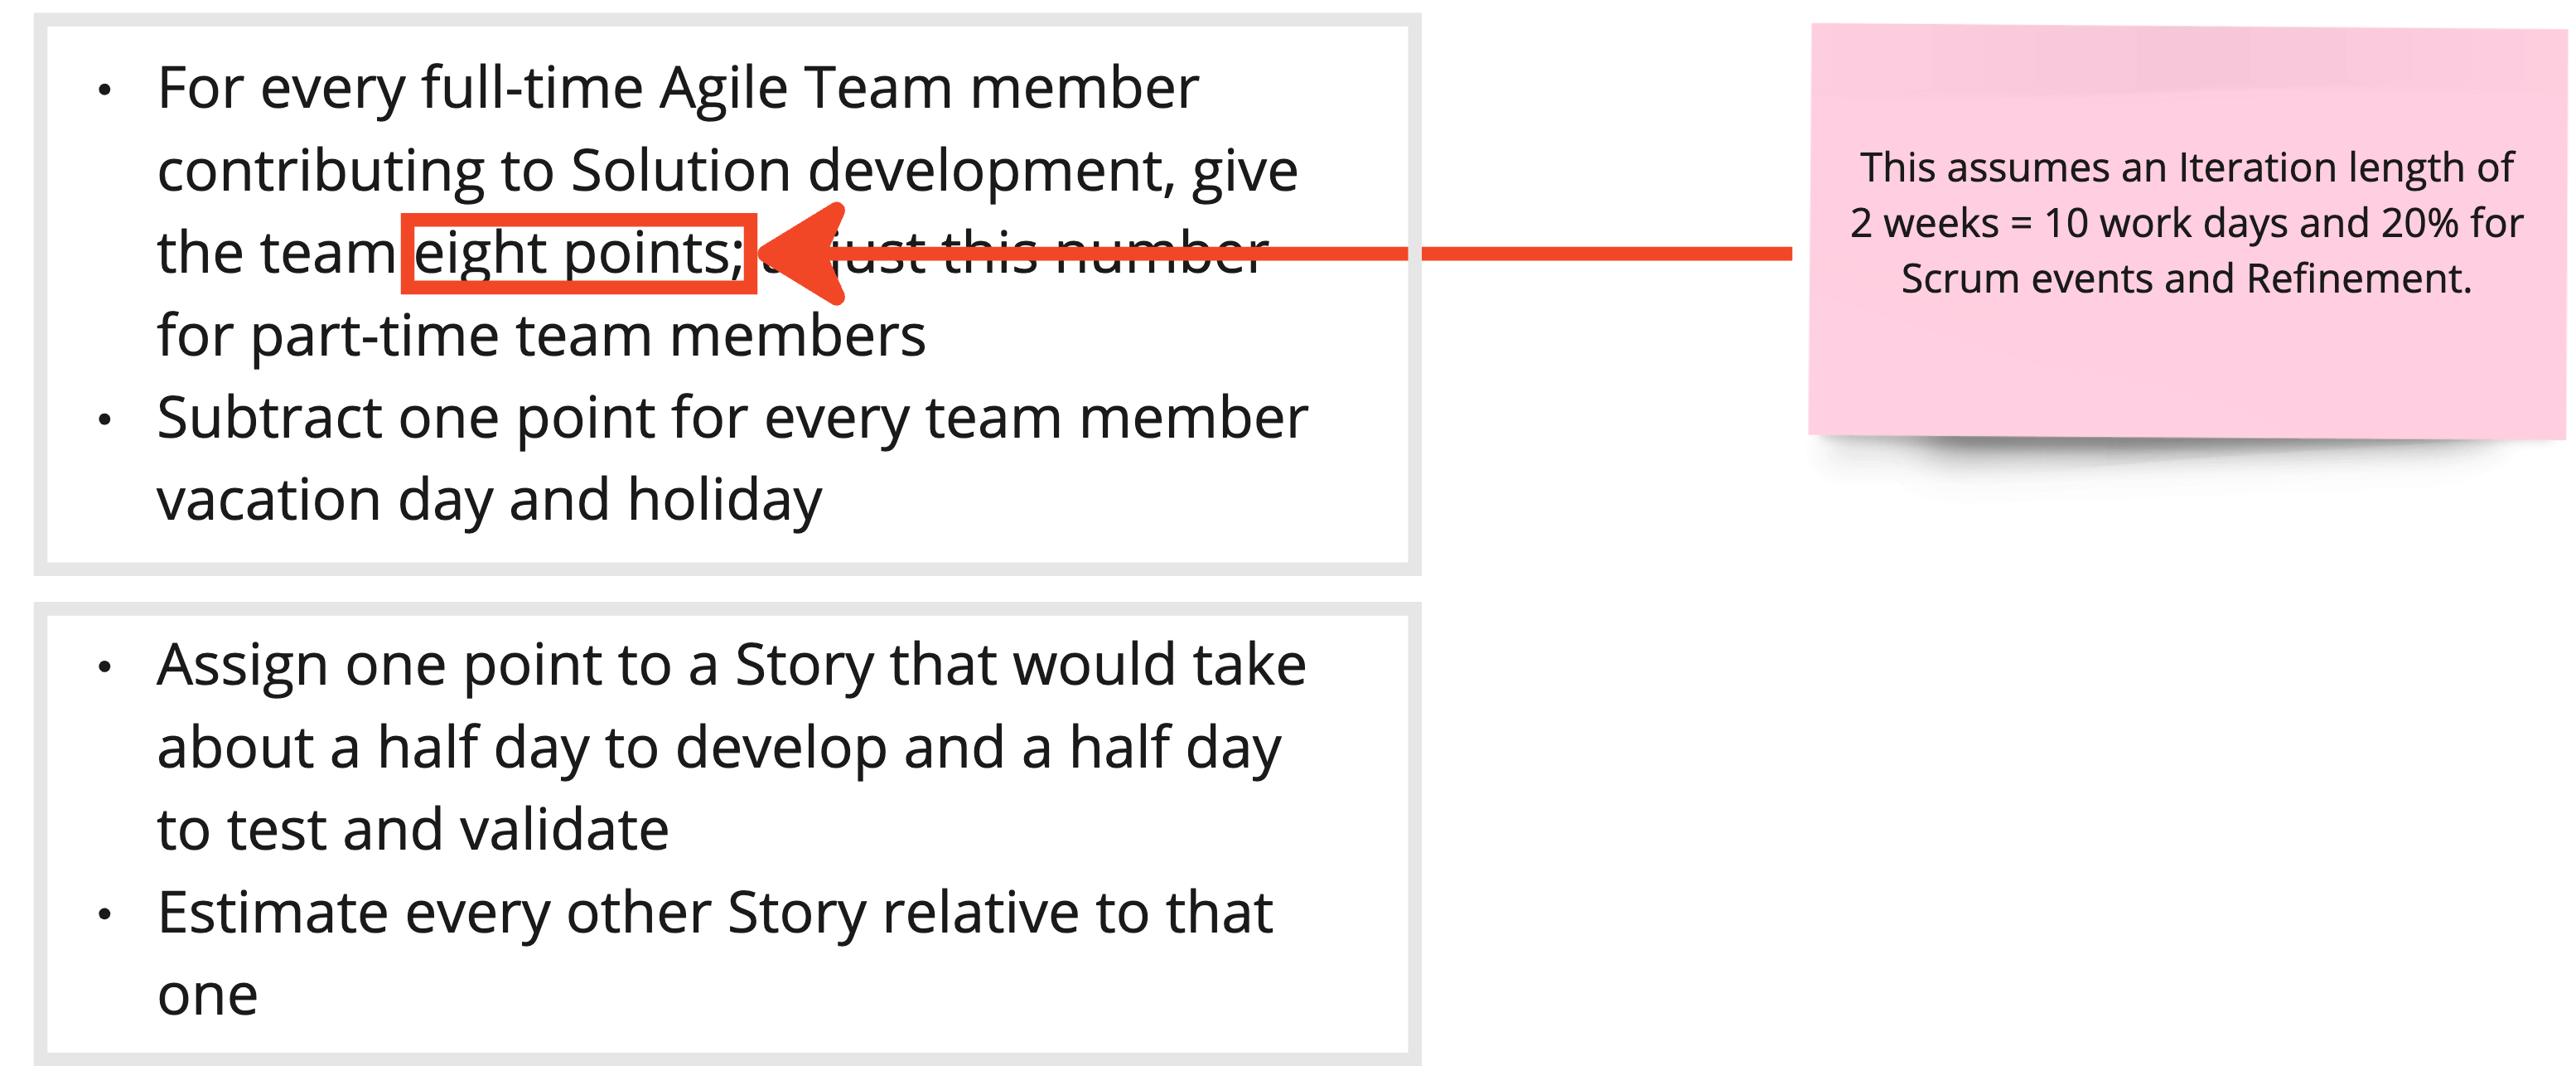
- “For every full-time Agile Team member contributing to Solution development, give the team eight points; adjust this number for part-time team members
- Subtract one point for every team member vacation day and holiday
- Assign one point to a Story that would take about a half day to develop and a half day to test and validate
- Estimate every other Story relative to that one”
These four points can also be found on the SAFe website. They are in the Story article under the section “Starting Baseline for Estimation”. The statements in this article therefore do not only apply to what is taught in SAFe training courses. They apply to SAFe in general.
The slide talks about Story Points and Capacity, which are different things.
First, let us look at the two concepts that are present on this slide. All four bullets of the slide are under the heading “Calculating Iteration Capacity”.
- The top two bullets are about Capacity (= forecasted Velocity). The unit of Velocity or Capacity is “Story Points/Iteration”, or more generally, items per time (see the definition of Velocity and of Flow Velocity).
- The last two bullets are about Story Points. The unit is “Story Point (SP)”.
So, we are talking about two different units, and therefore two different things.
The slide says, “Calculate your capacity.” But it is only about calculating initial Capacity.
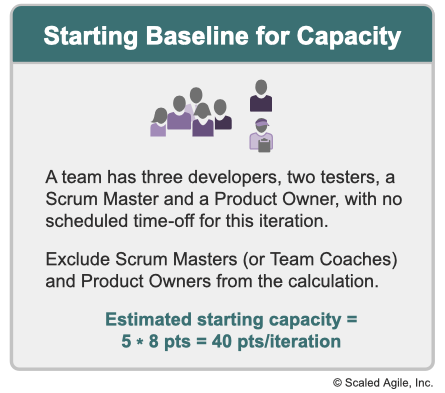
The headline of the slide says, “Calculate your Capacity” and “Calculating Iteration Capacity”. Without context, one might think that the slide explains how to calculate Capacity in general. However, the Capacity calculation with “8 points for every full-time developer” is a starting baseline for Capacity (initial Capacity) when there is no historical data.
We need to make clear that the steps of this slide are done only once: before the very first Iteration/Sprint “when the team is new and the Velocity is unknown” (quote from Iteration Planning article).
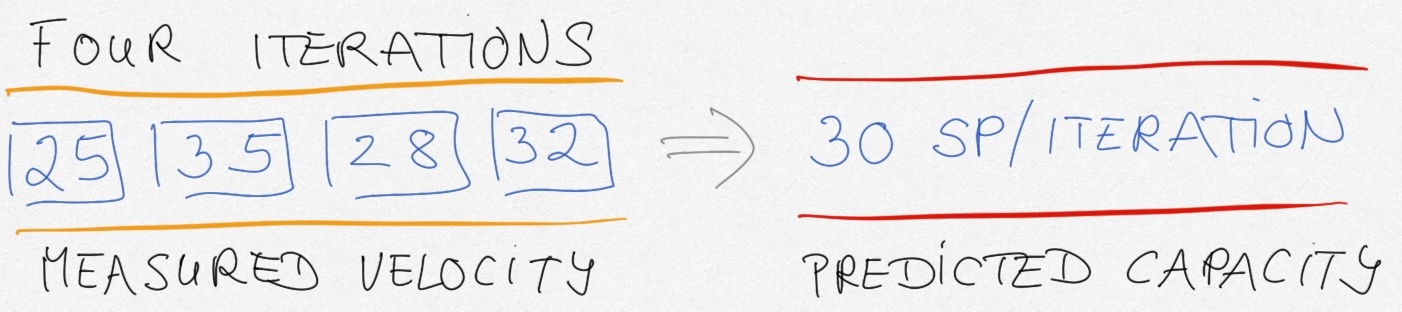
After the initial Iteration/Sprint, forecast Capacity based on measured Velocity.
Calculating Capacity after the first Iteration/Sprint is based on measured Velocity. “The team forecasts its capacity for an upcoming iteration by using its historical velocity as a starting point” (quote from Iteration Planning article). Teams need to understand this at the latest in the SAFe for Teams training. After the first Iteration/Sprint teams will start forecasting Capacity based on Velocity.
It would be a big mistake to calculate Capacity based on “8 points for every full-time developer” in every Iteration/Sprint.
Here is one way to forecast Capacity:
- Use the moving average of the Velocity of the last n Iterations/Sprints.
- If the workdays in the Iterations/Sprints are very different, you can adjust the moving average using the rule of three: Take the average Velocity, divide it by the average full-time workdays of the team in the last n Iterations/Sprints, and multiply it by the available full-time workdays in the next Iterations/Sprint.
Capacity and Velocity are closely related: Velocity is measured; it is the amount of work delivered per Iteration in the past. Capacity is forecasted Velocity, considering team member availability.
The Story article defines Velocity: “The team’s Velocity for an iteration is equal to the sum of the Story Points for all the completed stories that meet the definition of done (DoD)”. A team’s historical average Velocity is the best predictor of how much the team can achieve in future Iterations. The unavailability of team members will most likely have a negative impact. Proportionally adjusting the Velocity is a simplification. Anything to do with relative estimation is a simplification because we want a “good enough to go” attitude and avoid wasting time on perfect metrics.
Understand the assumptions behind the “8 points for every full-time developer”. Make adjustments if necessary.
The calculation suggests that “for every full-time Agile Team member contributing to Solution development, give the team eight points”. This is based on several assumptions:
- The length of an Iteration/Sprint is 2 weeks (which leaves us with 10 working days);
- 10% of our time is spent on Iteration/Sprint events (as suggested in the Scrum Guide);
- 10% of our time is spent on Product Backlog Refinement (as suggested in earlier versions of the Scrum Guide);
- Our reference Story, which represents “1” Story Point, takes about half a day to develop and half a day to test and validate.
If your actual Iteration/Sprint length is different (e.g. a week), you will need to adjust the calculation accordingly. Also, if your reference Story, which represents “1” Story Point, is different from “half a day to develop and a half day to test and validate”, you will need to change the calculation as well.
Do not put too much effort into calculating the initial Capacity. We only do it once in the life of an ART. The initial Capacity is always a guess. If the initial Capacity calculation takes longer than five minutes, I suggest simply “loading” the first Iteration Story by Story until the team feels they have pulled enough. Count the Story Points of the pulled items. Use that as your estimate of initial Capacity.
The slide is about finding a reference Story that represents “1” Story Point.
The last two bullets on the slide are about estimating with Story Points (SP).
One bullet instructs the students to “assign one point to a Story that would take about a half day to develop and a half day to test and validate”. This addresses two things: establishing a reference Story for “1” Story Point and aligning the size “1” between multiple teams (because all teams use the same algorithm to find the size “1” Story).
It cannot be emphasized enough that the reference is the Story that was found, not an “ideal” person-day. The text in the Iteration Planning article makes this clear: “Each team finds a small Story […]. Call it a ‘one.’”
Just like calculating the initial Capacity, finding the reference Story for “1” SP is done only once in the life of an ART: before the first PI. Once we have found a Story that represents “1” SP, we use that Story and all the other Stories that have already been estimated as a reference. (See my article on Agile Estimation in SAFe: Debunking Myths and Clarifying Practices.)
Note that each team finds its own size “1” reference Story. You can align the Story Points between teams, but you do not have to.
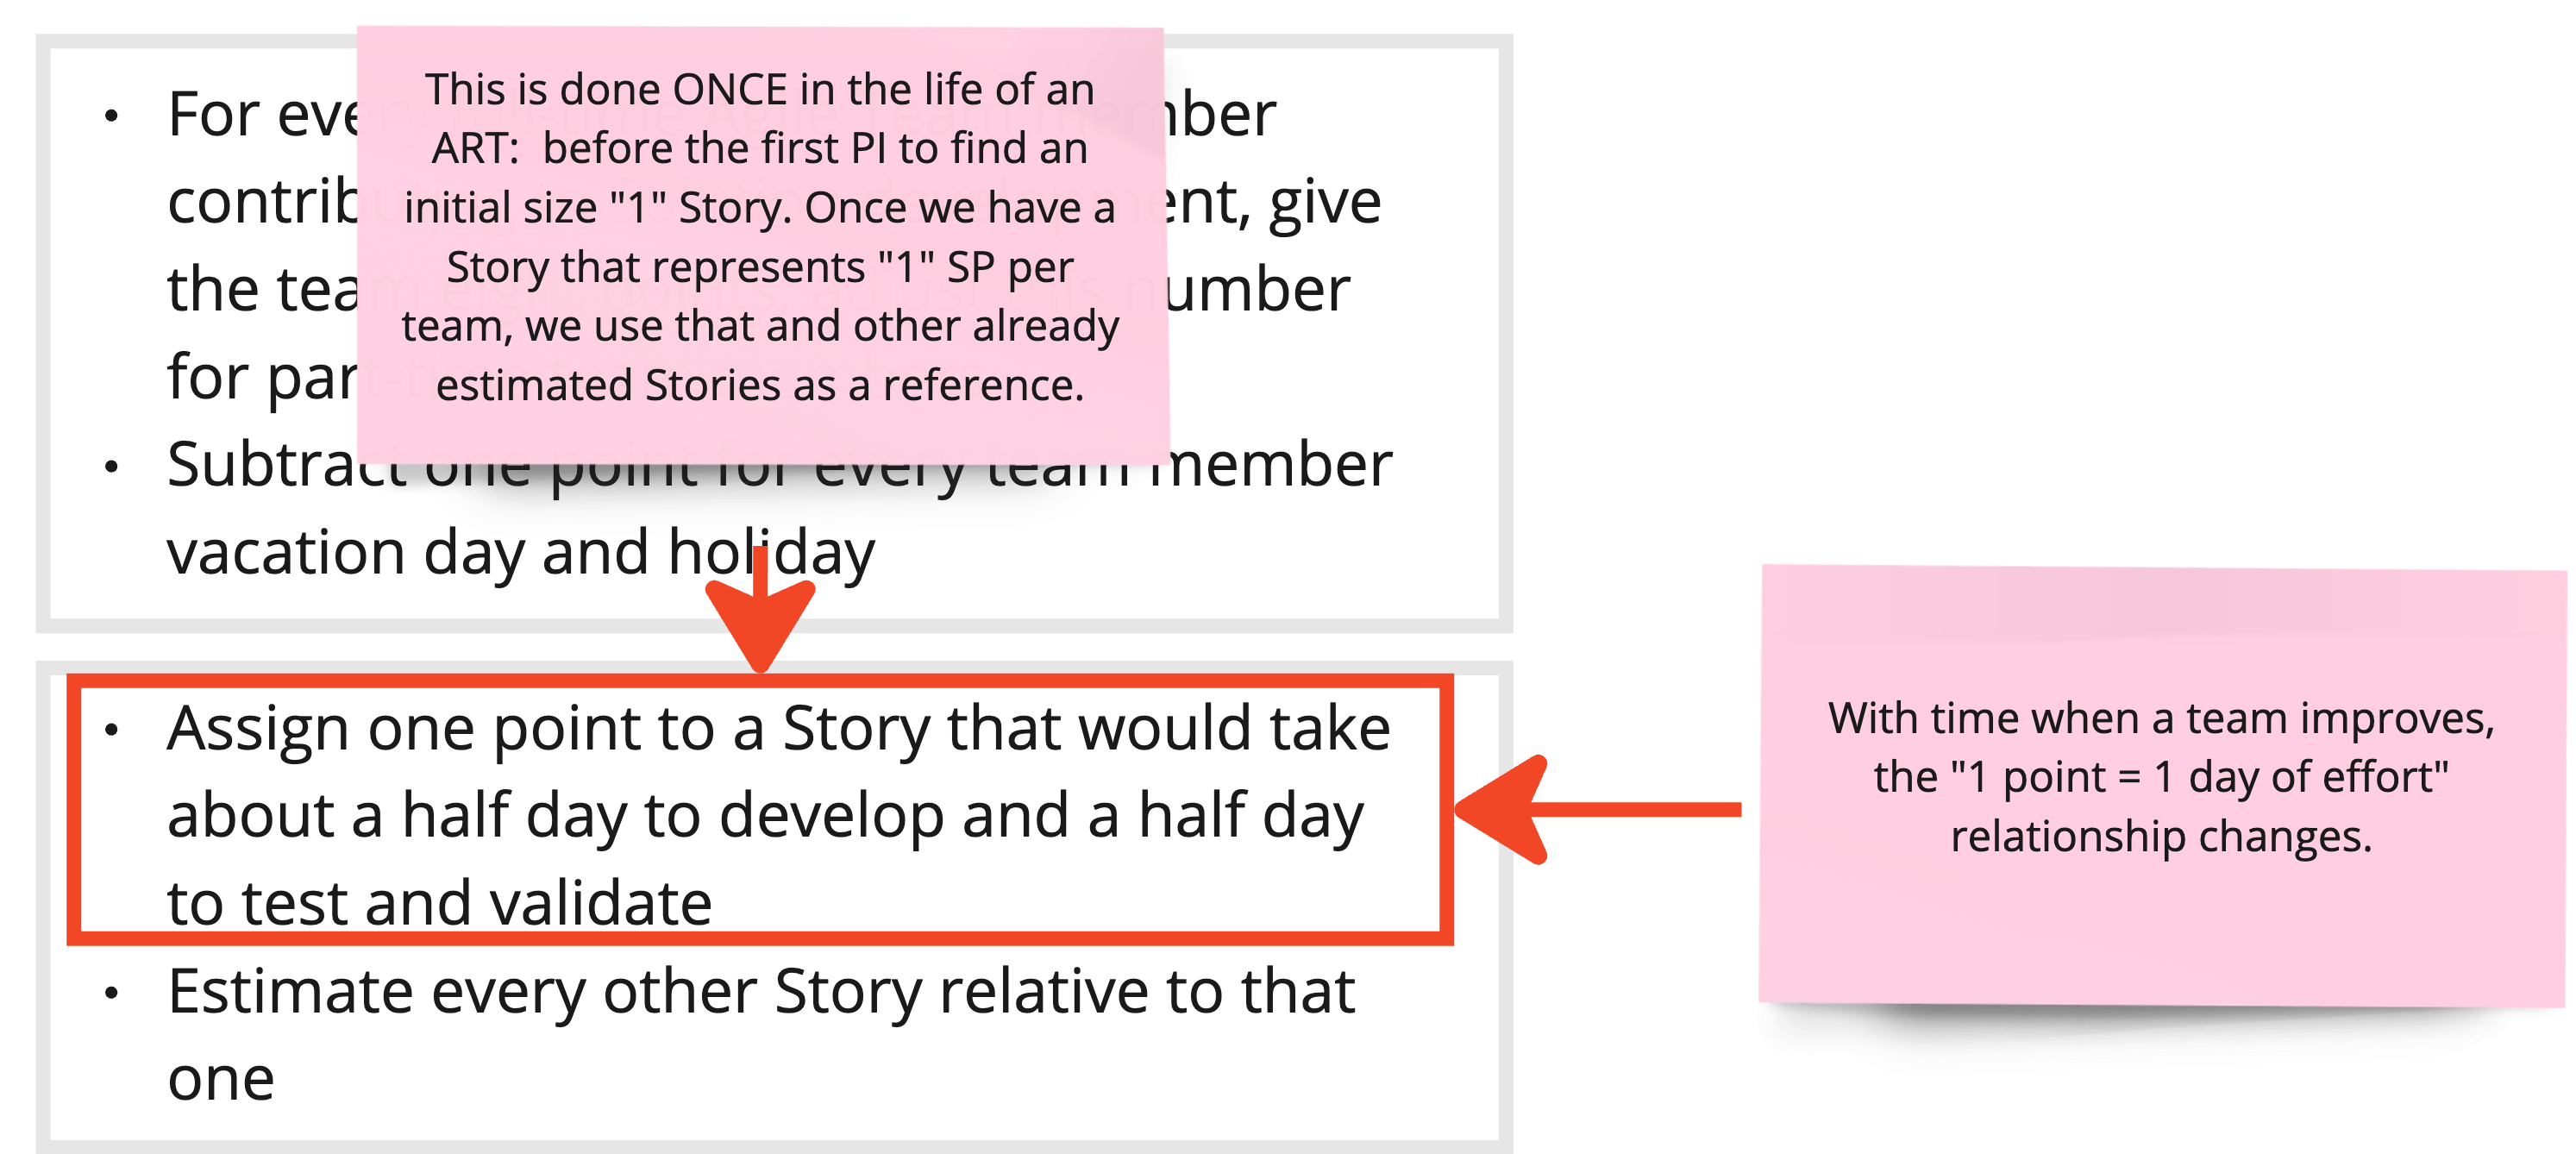
Story Points have a relationship to effort that changes over time.
Although we use the algorithm “assign one point to a Story that would take about a half day to develop and a half day to test and validate” to find a size “1” reference Story, there is no fixed relationship between Story Points and effort.
Over time, as a team improves, the “1 Story Point = 1 day of effort” relationship changes. That means: Except for the first Iteration, one Story Point does not equal one day of effort. We need the current Velocity to predict the current duration/effort for a Story:
durationt = size * velocityt or
effortt = size * velocityt * teamsize
Using the algorithm “assign one point to a Story that would take about a half day to develop and a half day to test and validate” for anything other than finding the reference Story before the first Iteration would be a huge mistake.
The slide can easily lead people to believe that there is a fixed relationship between “size in Story Points” and “effort”. However, it is a good practice to decouple size from duration/effort. Story Point estimation does that and uses Velocity to predict duration/effort based on actual, current, and evolving data. The whole concept and benefit of size estimation with Story Points is defeated by a fixed relationship between size and effort. Therefore, we cannot be too careful when using the “1 Story Point = 1 day of effort” algorithm.
Why we decouple size from effort:
At any given moment, size is related to duration and effort. The factor in this relationship is the current Velocity (or Throughput). The Velocity of a team changes as the team improves or as we introduce techniques like test automation. As the Velocity changes, the duration and effort change. While size tends to be stable, Velocity tends to change. Decoupling size from duration/effort helps us to have a prediction of duration/effort based on current data without having to re-estimate the items. Decoupling size from duration/effort means that there is no fixed relationship between size and duration/effort, but we use a current Velocity to make a current prediction of duration/effort.
Even SAFe falls into the trap of a fixed relationship between size and effort. In the SAFe for Teams training, slide #4-16, titled “Fibonacci is used for estimation,” states: “Typically, a 1-point story would take 1 day to develop and test”. As a general statement, this is incorrect.
All techniques on the slide are optional.
The initial Capacity calculation on the slide is “one method for initially forecasting the team’s capacity”. This means that the calculation is only a suggestion, and you may choose other techniques.
Aligning Story Points (also called normalizing) between teams means that their size “1” reference Stories are approximately the same size. Aligning is an option in SAFe, but not a requirement (“can be”).
Also, the algorithm “Find a small story that would take a day to develop […]. Call it a ‘one.’” is “one approach” and not mandatory.
All quotes are from the article on Iteration Planning.
To get it right, refer to the Iteration Planning article on the SAFe® website.
A more detailed version of the four bullets on the slide can be found on the SAFe website. You find it in the Story article under the section “Starting Baseline for Estimation”, and in the Iteration Planning article under the headlines “Estimating Stories and Forecasting Team Capacity” and “Creating a Shared Basis for Story Point Estimation.”
The text in the Story article is clear about the calculation being an initial baseline, but it still mixes Capacity and Story Points. A more refined text can be found in the Iteration Planning article. I therefore refer people to this article.
With a nod to critics, I agree that the content on estimation and forecasting could be improved. More clarity in the slides, and synchronizing the sections in the Story article and the Iteration Planning article would be good. Hopefully we will see this in version 6.1.
Here is a general piece of advice for implementing SAFe®. Stay true to the embedded frameworks and use the wealth of agile knowledge as guardrails.
The discussion of this slide should show that real, deep experience not only with SAFe, but also with the embedded frameworks is key to implementing SAFe. If things contradict long-term agile experience, SAFe is probably being implemented incorrectly. Good SAFe implementations are true to the frameworks that SAFe embeds. The wealth of knowledge around the embedded frameworks is a good guardrail for using SAFe. If you hit those guardrails, think twice. Re-read SAFe. Re-read the original embedded framework. Think about what would be inside the guardrails. Go that way.
Thank you, reviewers.
Estimation is a tough subject. I would like to thank my reviewers who greatly improved this article: Simon Porro, David Croome, Michele Lanzinger and the SAFe Framework Team.
Want to learn more? Come to one of our training courses.
We cover the above topics in our Leading SAFe training or in our Implementing SAFe training. Experience a training with a lots of hands-on activities, good discussions and experienced experts. Meet the people with the most practical experience in scaling agile and establishing business agility.
Read my other article on SAFe® estimation:
All quotes from the SAFe website are © Scaled Agile, Inc.